A More Active Palm Beach Market
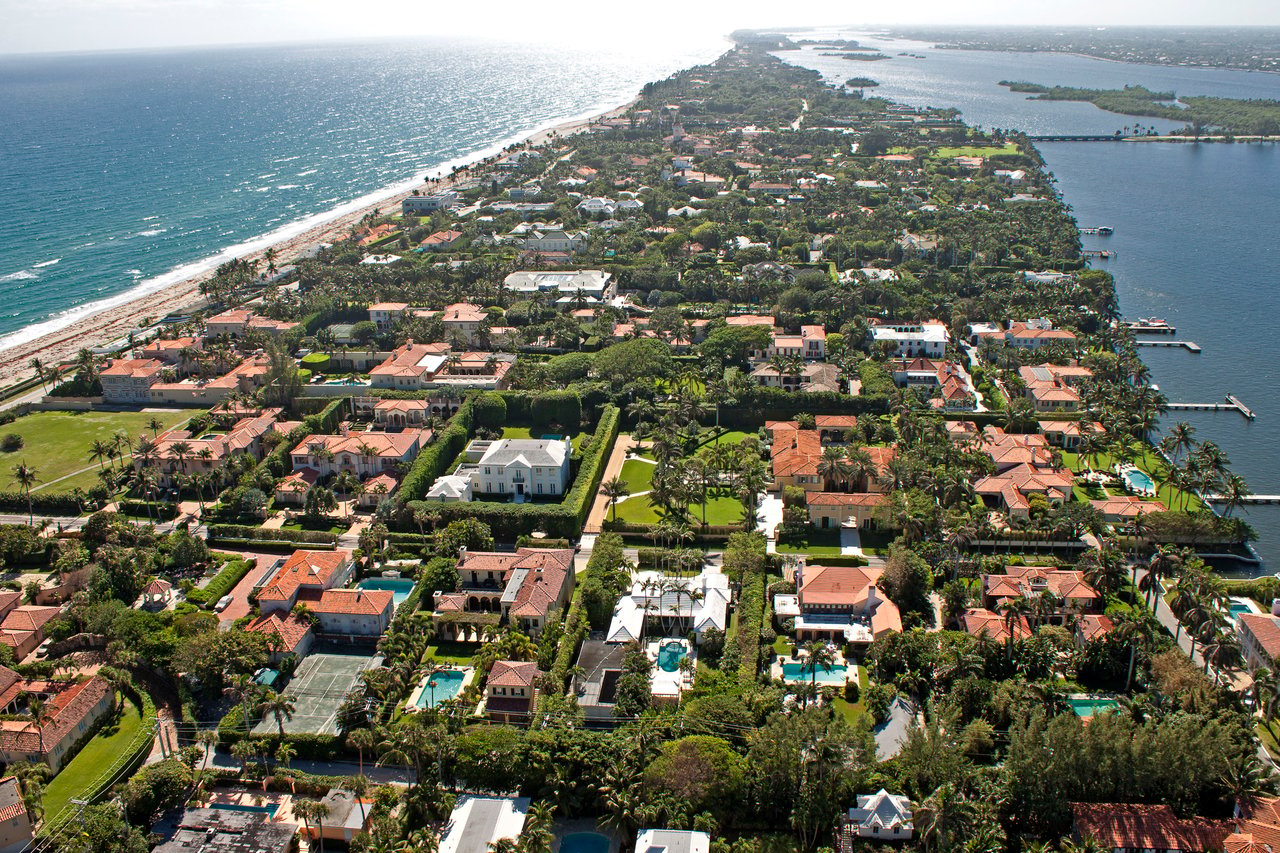
Palm Beach's residential real estate market gained momentum in the second quarter of 2026, with year-over-year transaction growth across single family homes and both condominium markets.
The increase in activity was particularly noteworthy because it extended beyond the island's highest-priced estate sales. Midtown and South End condominiums also recorded meaningful gains in completed transactions, demonstrating demand across a wider range of property types and price points.
Total sales volume increased substantially, supported by both a greater number of transactions and higher average sale prices. At the same time, buyers continued to distinguish among properties based on location, condition, quality and value.
The defining story of Q2 was broader market participation, supported by sustained demand and increasingly limited available inventory.
Single Family Homes: Greater Activity and Substantial Sales Volume
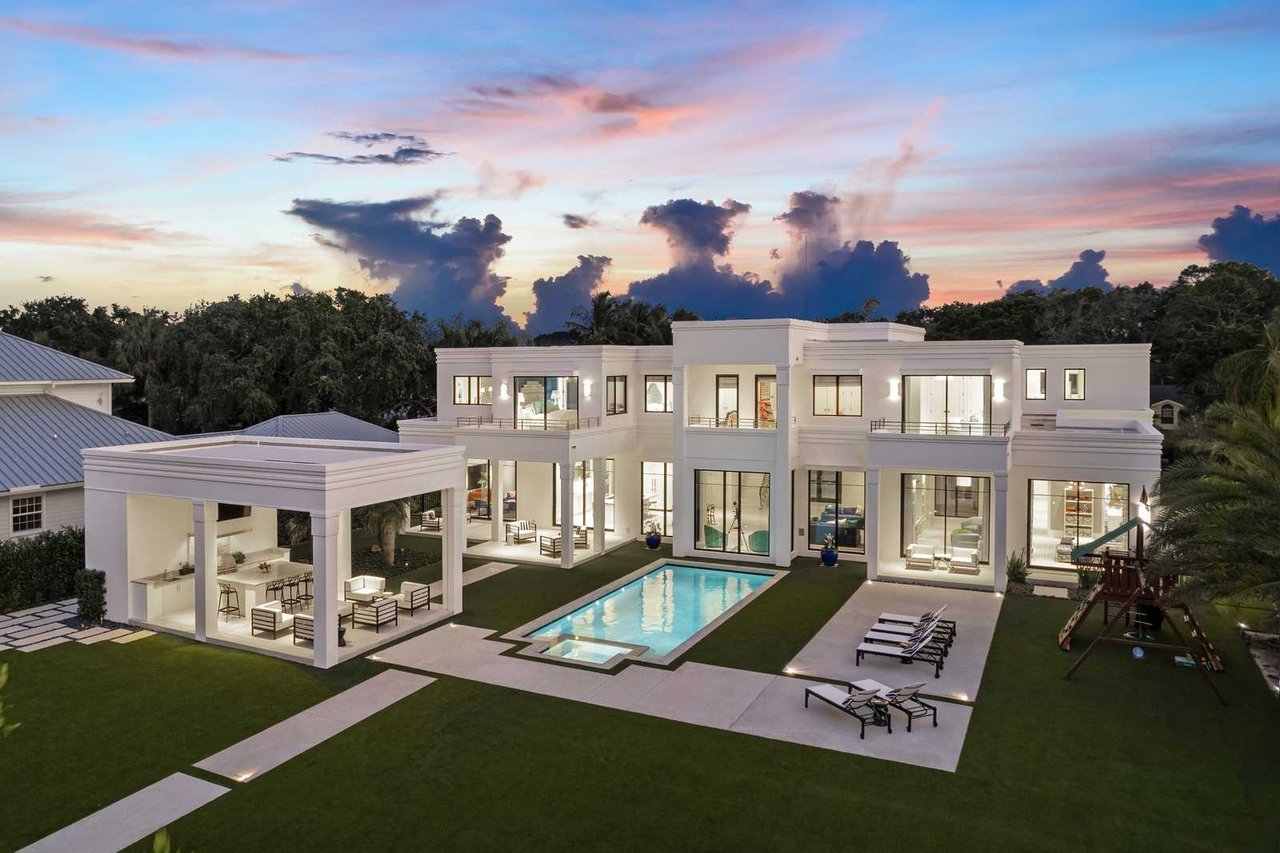
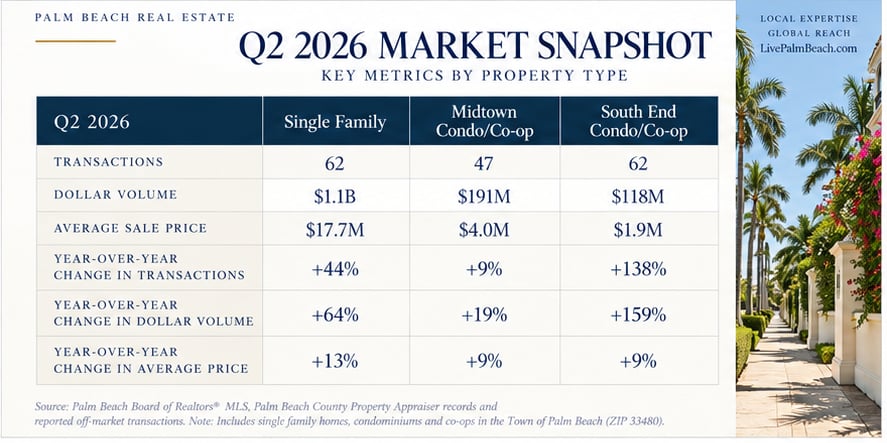
Palm Beach recorded 62 single family transactions during the second quarter, a 44% increase over Q2 2025.
Total sales volume approached $1.1 billion, representing a 64% year-over-year increase. The average sale price reached $17.7 million, up 13%, while the median sale price rose 12% to $13.6 million.
Exceptional properties continued to account for a significant share of market activity, including a $93.3 million off-market lakefront estate sale on Everglades Island.
Yet the broader transaction figures are equally important. The increase in completed sales suggests that activity was not confined to a handful of extraordinary properties.
The first-half results reinforce that perspective. During the first six months of 2026, Palm Beach recorded 104 single family transactions totaling more than $1.9 billion. Compared with the same period in 2025, transactions increased 30% and dollar volume rose 32%.
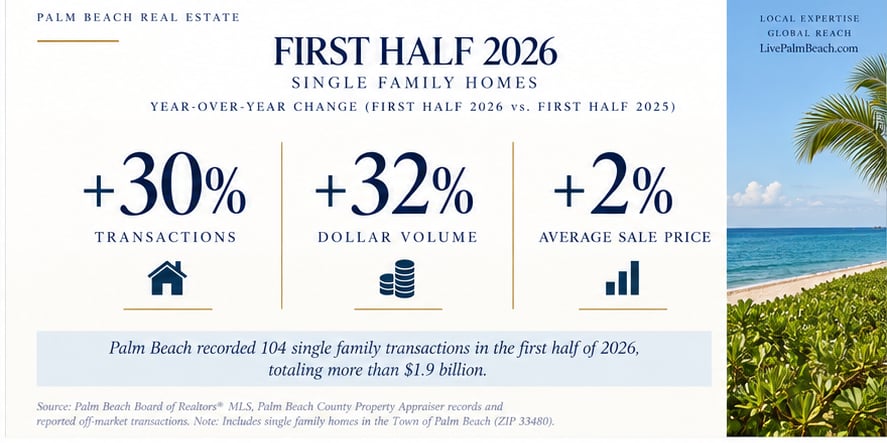
The relatively close relationship between first-half transaction growth and dollar volume growth suggests that increased activity, rather than dramatic overall price escalation, was an important driver of market performance.
For buyers and sellers, this distinction matters. Strong aggregate statistics do not mean every property is appreciating at the same rate. Individual location, land value, architectural quality, condition and competitive positioning remain central to determining value.
Condominiums: Stronger Activity, Distinct Markets
Palm Beach's condominium and co-op markets also experienced increased activity during Q2, although Midtown and the South End continued to demonstrate distinctly different pricing characteristics.
Midtown: Premium Location and Limited Supply
Midtown recorded 47 condominium and co-op transactions, a 9% increase over Q2 2025.
Total sales volume reached approximately $191 million, up 19% year over year. The average sale price was $4.0 million, an increase of 9%, while the median was $2.7 million, down 4%.
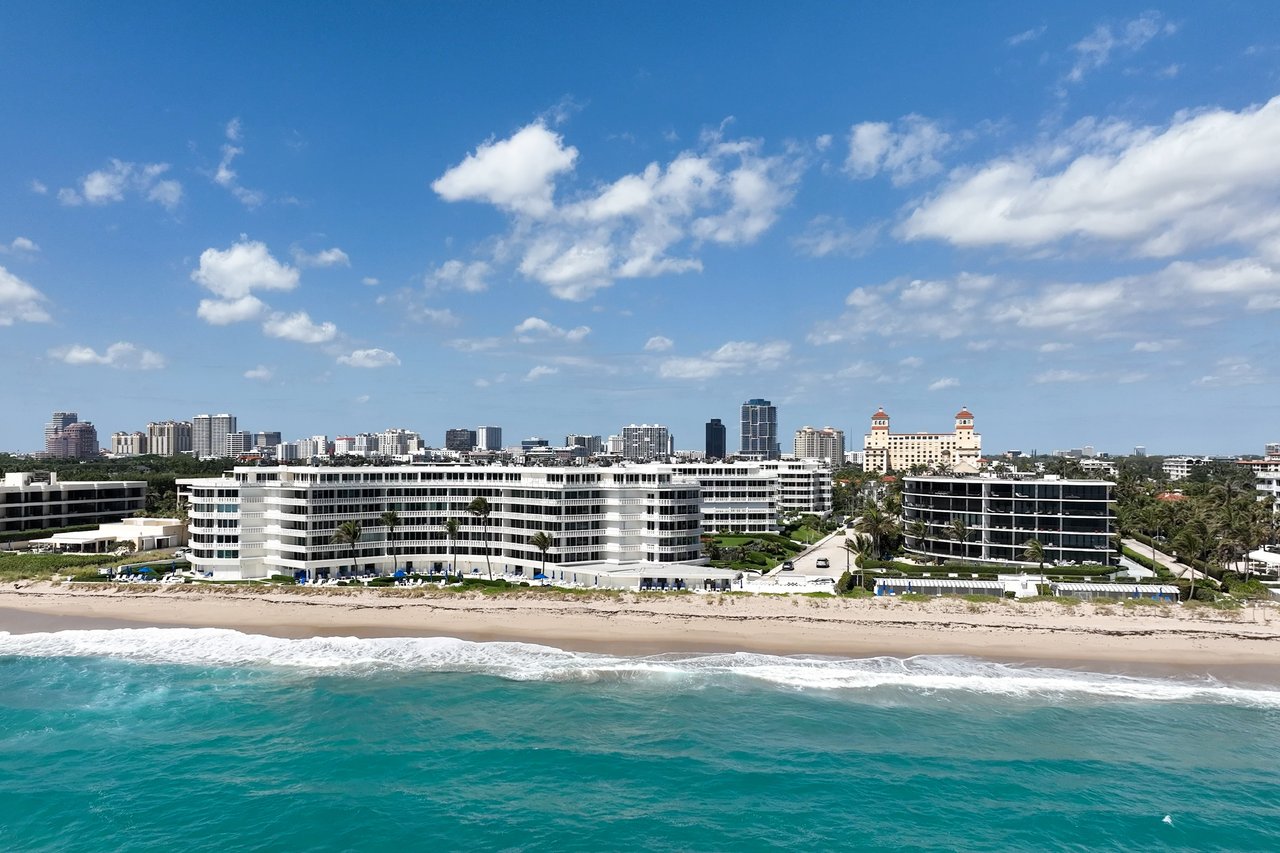
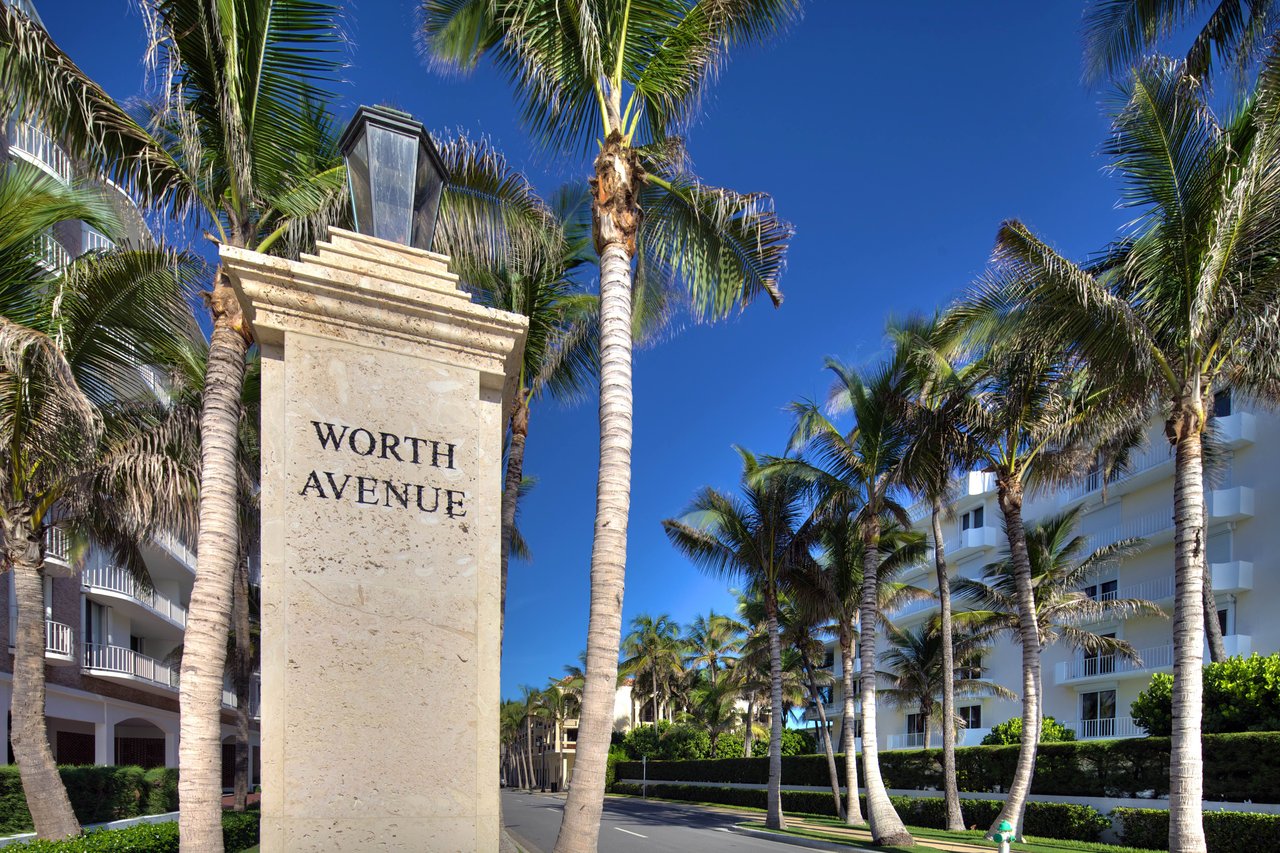
Midtown's pricing premium reflects its central location, proximity to Worth Avenue, restaurants, clubs and the ocean, and the limited availability of high-quality residences in the heart of town.
The difference between average and median price performance also illustrates the influence of individual high-value transactions on this relatively small market.
South End: Broader Participation and Increased Activity
The South End recorded 62 condominium and co-op transactions, a 138% increase over Q2 2025.
Total sales volume reached approximately $118 million, up 159% year over year. The average sale price was $1.9 million, an increase of 9%, while the median remained essentially unchanged at $1.5 million.
The South End offers a broader range of condominium options and price points, attracting buyers seeking oceanfront and waterfront living across a variety of buildings and residential styles.
The substantial increase in transactions, alongside comparatively modest average price growth, is particularly significant. It points to a meaningful expansion in market activity rather than a surge in pricing across the segment.
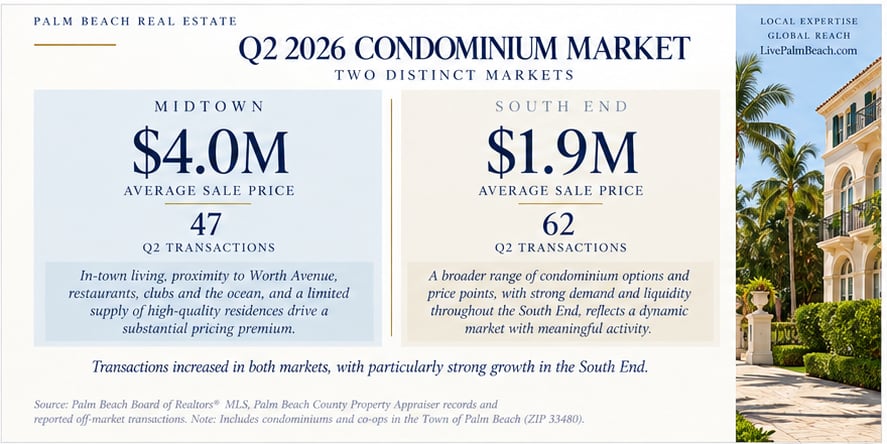
While both condominium markets experienced greater activity, Midtown's average sale price remained approximately twice that of the South End. This difference underscores why Palm Beach condominiums are best evaluated by location, building, amenities, financial condition and individual residence rather than through a single island-wide average.
Inventory and Market Balance: Less Available Supply
Available inventory declined across all three residential market segments during the second quarter.
At June 30, 2026, there were 77 single family listings, down 21% from the prior year. Midtown condominium and co-op inventory stood at 44 listings, a 40% year-over-year decline, while the South End had 103 listings, down 13%.
These figures represent approximately four months of single family supply, three months in Midtown and five months in the South End.
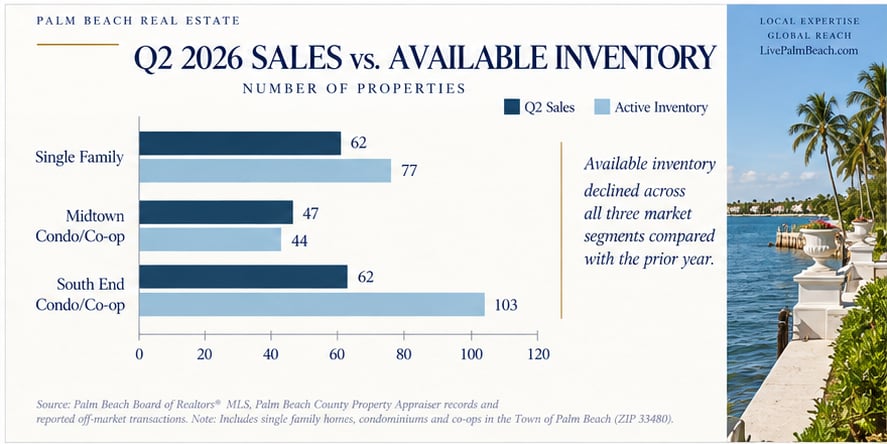
The decline in inventory, combined with increased transactions, suggests that available properties were being absorbed at a meaningful pace.
Nevertheless, inventory conditions vary considerably by property type, price point and individual building. A limited supply of highly desirable residences does not necessarily translate into equally strong demand for properties requiring extensive renovation or carrying ambitious asking prices.
Buyers remain attentive to property condition, location, renovation requirements and overall value. Sellers benefit from understanding these distinctions and positioning their properties accordingly.
What Q2 Tells Us About the Palm Beach Market
Several themes emerge from the second-quarter results.
Activity broadened across property types. Single family homes, Midtown condominiums and South End condominiums all recorded year-over-year transaction increases. The particularly strong growth in the South End demonstrates that market participation extended well beyond trophy estates.
Dollar volume increased substantially. More completed transactions contributed to higher aggregate sales volume, while average prices also increased. The market's strength reflects both activity and value, although the relative importance of each varies by segment.
Available inventory tightened. Year-over-year declines across all three segments reinforce the scarcity of residential offerings in Palm Beach, particularly in Midtown.
Palm Beach remains a collection of distinct markets. The differences between single family homes, Midtown condominiums and South End condominiums illustrate why broad market statistics are only a starting point for understanding an individual property's competitive position.
Property-specific analysis remains essential. Increased market activity is encouraging, but successful decisions still depend on evaluating location, condition, quality, pricing and the alternatives available to buyers.
Looking Ahead
Palm Beach entered the second half of 2026 with increased transaction activity, substantial sales volume and reduced available inventory across its principal residential markets.
These conditions provide a constructive foundation as the island approaches its winter season. At the same time, the market continues to reward thoughtful decision-making rather than assumptions based solely on headline statistics.
For sellers, this environment reinforces the value of strategic pricing, strong presentation and a clear understanding of competing properties. For buyers, it highlights the importance of distinguishing between exceptional opportunities and properties whose pricing may not fully reflect their condition or market position.
Palm Beach continues to demonstrate considerable strength. The most informed decisions, however, are grounded in understanding the details behind the numbers.
If you are considering buying or selling in Palm Beach, I welcome the opportunity to discuss how these market trends may influence your plans and the opportunities available in today's market.
Nadine Fite
Luxury Real Estate Advisor | Palm Beach County
📱 917.513.9592
🌐 LivePalmBeach.com
Follow Along: @Nadine_Fite_PBRealtor
#LivePalmBeach
Data sources: Palm Beach Board of Realtors MLS, Palm Beach County Property Appraiser records and reported off-market transactions. Market coverage: ZIP code 33480. Figures include transactions beyond MLS-recorded sales; percentages and dollar values are rounded.